Limiting Chance is a series that uses mathematics and probability to investigate aspects of Limited play. In this article, I hunt for the perfect mana curve.
Routes to Victory
Magic is complicated. Any number of crazy things can lead to a win or a loss. Sometimes, the game comes down to a single brilliant play that clutches victory. Sometimes, I have to take a heart stopping risk and bluff my opponent into losing. Those games make the best stories.
But nine times out of ten, I win (or lose) for much more straightforward reasons.
- Card quality – The spells I cast over the course of the game are incrementally stronger than my opponent’s. I’m not talking about splashy rares, but just a higher density of quality commons and uncommons. Perhaps I’m a more skillful drafter than my opponent. Maybe I just got lucky and was the only Boros player at the table. Whatever the reason, sometimes card quality sees me through to victory.
- Card advantage – Over the course of the game, I bring more spells to bear than my opponent, and I overwhelm him. Perhaps the game went long and I have several late game two-for-ones or a card drawing engine. Perhaps I pulled ahead in card advantage by forcing chump blocks or through combat tricks. Or maybe I was lucky and my opponent drew a run of lands. However I got there, my card advantage overwhelms my opponent.
- Faster development – Even when my card quality is low and I have no direct way to earn card advantage, if I can deploy my creatures faster than my opponent, I’m likely to win. Even if this doesn’t lead to a quick victory, if I can put my opponent on their heels, they will be forced to sacrifice card advantage to survive or trade their superior creatures with my average ones.
It is that third route to victory that I will focus on in this article.
I attempt to answer this question: what deck composition maximizes my probability of quickly developing my early board position? Or stated more directly, what’s the best mana curve?
Curving Out
Curving out means to use all of my mana in every turn of the early game. Thus, the goal of my first calculation is to maximize the mana I use in the first five turns of the game.
Here is the setup. I have a 40-card deck with seventeen lands and 23 spells. Of those 23 spells, there is some number of one-cost spells, some number of two-cost spells, some number of three-cost spells, and so on up to casting cost five. Given a particular mana curve, I can use the Magic Probability Toolkit to calculate the amount of mana spent during the first five turns averaged across all games played.
I assume that all spells in the deck actively develop my board presence. I assume that on each turn I cast the highest cost spell that I can afford. If I have mana remaining, I continue to cast the highest cost spell I can afford. In this calculation, I ignore color. I assume that if I have mana equal to a spell’s converted mana cost, I can cast that spell. I assume that all mana goes towards casting spells; none goes towards activated abilities or other mana sinks.
I do the calculation on the draw and on the play, and I average the results. I model the effect of mulligans using the mulligan tables calculated in previous articles.
That’s a lot of assumptions and simplifications, but none of the simplifications are too unrealistic. It basically corresponds to a deck of land and vanilla (or French vanilla) creatures. It’s a solid baseline on which to build an understanding of mana curves.
Mana Curve
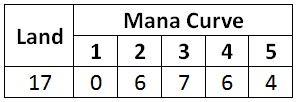
Let’s start with a deck that has the following fairly typical mana curve.
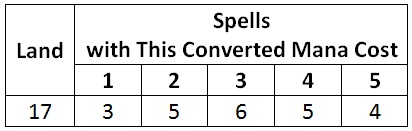
According to the Magic Probability Toolkit, the average amount of mana I consume in the first five turns of the game using a deck with this mana curve is 11.7.
Is that good? Well, the maximum possible amount I can spend is fifteen. That’s how much I spend when I curve out perfectly. One mana on turn 1, two mana on turn 2, and so on up to five mana on turn 5. This curve gives an average result of about twelve, which is fairly close to fifteen. So it seems like a reasonable mana curve.
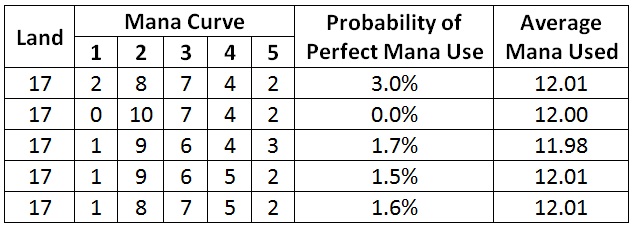
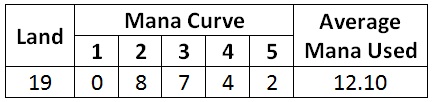
But is it the best? Probably not, since I just pulled the mana curve out of thin air. What if I change my deck’s curve slightly? What effect does that have on my results? I’ll change one of my one-drops into a four-drop. Here are the results of both decks in a single table.
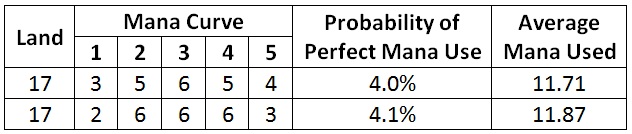
(Note that I have also calculated the probability of each deck curving out perfectly, spending fifteen mana in the first five turns. For both decks, that probability is quite low.)
Changing my mana curve increased the average mana used. This new curve is better, but it is probably not the best. There is a single mana curve that is going to result in the highest value for average mana used. That is the mana curve I’m looking for. How do I find it?
Maximization
What I have on my hands is a multivariable maximization problem. One way to solve it is to calculate the average mana used for every possible mana curve and see which one is largest. While straightforward, that takes far too long for my computer to complete. There are 17550 different possible mana curves, and it takes my computer about ten seconds to calculate average mana used. That adds up to about two days to do the calculation.
Instead, I use a standard method known as hill climbing to find the maximum. If you are curious about the specifics, I talk more about my methods at the end of the article.
Here is the result of the hill climbing algorithm.
There I have it. The mana curve that maximizes my mana usage on the first five turns of play.
Here are the results for a few of the neighboring decks. As you can see, each of them has a slightly lower value for average mana used.
Other Metrics
Is average mana used what I want to be maximizing? There are many different quantities or metrics I could maximize. My real goal is to dominate the early game, to develop as strongly as possible, to curve out. Does that correspond to maximum average mana used? Maybe.
Let’s explore other possibilities and see if I can find a metric to maximize that corresponds more closely to a strong early game.
Curving Out Perfectly
It is interesting to note that in the previous calculation, the mana curve that gave the maximum average mana used did not give the highest probability of spending a perfect fifteen mana.
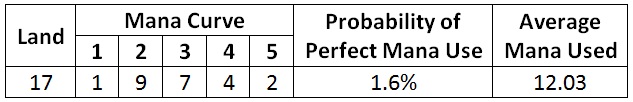
At face value, perfect mana consumption seems like a sensible goal. If I can do that consistently, it should correspond to a strong early game. What is the mana curve that results in the maximum probability of perfect mana use? Here are the results of that calculation.
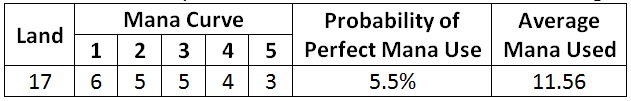
Notice that the average mana used has dropped, while the maximum obtainable probability for perfect mana use is only 5.5%
This curve has significantly more one-drops to make sure I don’t miss my turn 1 play. It favors low-cost spells in general because I can use them to fill holes on later turns. Casting a three-drop plus a one-drop on turn 4 counts as a perfect turn, as far as this calculation is concerned.
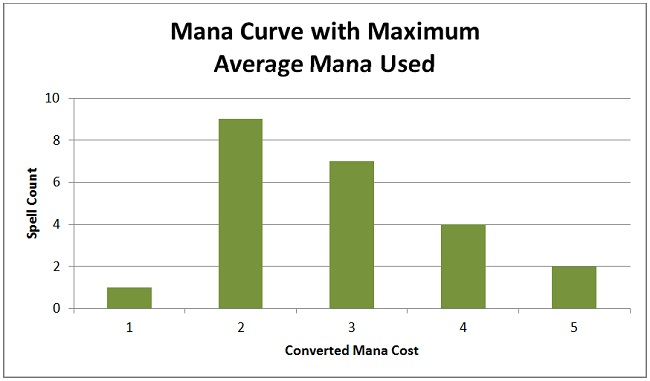
I can be more stringent. I can disallow hole filling. With that additional restriction, perfect mana use is defied to be casting a spell of the maximum cost possible on each turn up to turn 5. Here is the mana curve that maximizes that probability.
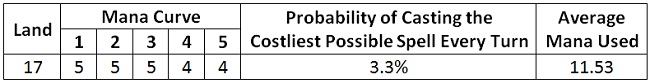
The result is a very even distribution. An even distribution maximizes the probability that I will draw one spell of each cost, which is the only way I can fulfill the stated goal. The distribution cannot be perfectly even because five does not divide evenly into 23. Four- and five-drops take the hit because I have a few extra draws to get to them before they are needed.
The maximum obtainable probability for a perfect early game is very low. Since it is impossible to make it likely for me to have a perfect early game, it is not the goal I should be pursuing.
Accounting for Spell Strength
If all I care about is the amount of mana spent, I am not accounting for the strength of the spells I am casting. I’m fairly sure that casting a three-drop makes for a stronger turn 3 than casting a two-drop plus a one-drop. But my earlier calculation that maximized mana use considered those to be equivalently good turns. That calculation cared only about total mana spent. Can I come up with a metric that accounts for the strength of the spells I am casting?
The most straightforward approach is to only count the most costly spell I cast each turn. If a cast a two-drop and a one-drop on the same turn, I only give credit for the two-drop. Here is the curve that maximizes that metric.
The curve has shifted somewhat to higher-cost spells. This metric disfavors lower-cost spells, as they don’t earn credit when cast on later turns as the second spell of the turn.
A Balanced Metric
Of course, that’s not quite accurate either. I know casting a four-drop on turn 4 is better than casting two two-drops, but casting two two-drops is still better than casting only one. This latest metric does not account for that fact. It treated those two turns as equivalent.
I need a metric that is based on the impact a spell has on the turn it is cast. I should give full credit to spells cast on their optimal turn. Spells should receive some credit, not full credit but also not zero credit, when cast on later turns. The later a spell is cast, the less credit it should get.
Here is the most straightforward metric I can devise that meats those criteria: for each spell cast, give credit towards the metric equal to the casting cost of the spell scaled by the spell’s optimal turn divided by the turn on which it is actually cast. For example, a three-cost spell cast on turn 5 counts three-fifth as much as one cast on turn 3.
To be explicit, here is a table of the credit given towards the metric for each spell cast.
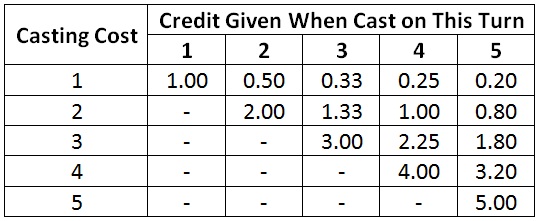
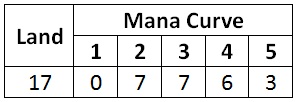
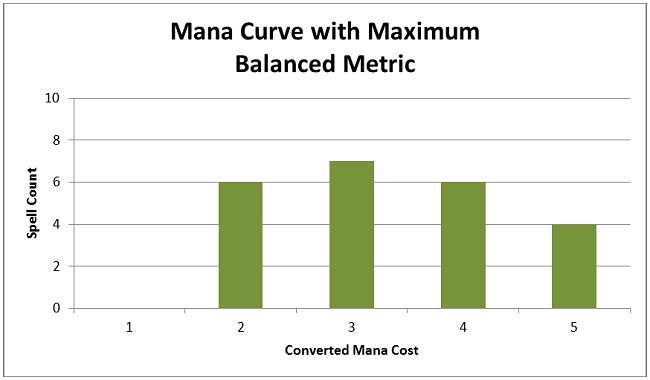
Maximizing that metric recommends this mana curve.
Off-Curve Spells
For the majority spells in my Limited decks, I want to cast the spell on curve—spells like creatures, equipment, and aggressive auras. I generally cast those spells as soon as I am able. However, there is another class of spells for which that is not the plan. For those spells, I wait until the most opportune time to cast them. Things like combat tricks and creature removal fall into this category. It does not make sense to count those spells in my mana curve.
I generally include somewhere between three and six such spells in a deck. When I do, how should I adjust my curve? From which casting costs of my curve should I pull the slots for off-curve spells?
Here are the curves that maximize the balanced metric when I include off-curve cards in my deck. For the purposes of the calculation, I simply consider such spells to be blank.
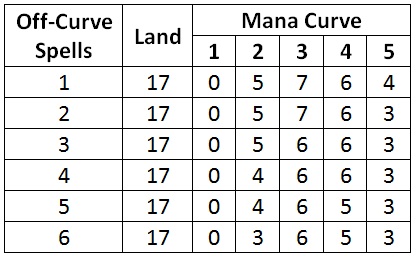
Two-drops are removed from the curve more quickly than other converted mana costs.
Varying Land Count
So far I have assumed a seventeen-land deck. What if I allow my maximization process to vary the land count of my deck? What number of land maximizes the strength of my early game?
Here is the result when maximizing the average mana spent.
Here is the result using the balanced metric.
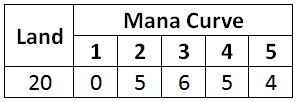
Both recommend a land count above seventeen. That is not surprising when you think about it. The goal of this calculation is to maximize my early-game development. Hitting those first five land drops is critical to that development.
What this calculation does not account for is the negative effect land draws have later in the game. In most blocks, Zendikar excluded, lands drawn late in the game are dead cards. So it is not surprising that if I was discounting that late-game effect, I would want to play more than the conventional number of lands.
This indicates that if I am piloting an extremely aggressive deck that cannot win if the game goes long, I should play nineteen or 20 lands.
Methods
In order to find the mana curves that maximize my various metrics, I use a technique called hill climbing. The technique is quite straightforward.
First, I choose a mana curve as my starting point. It doesn’t really matter what curve I choose. I calculate the value of the metric for a deck with that mana curve.
Then I make a small, random change to the mana curve, adding a spell with a random mana cost while removing a spell with a different cost. I calculate the metric for this new mana curve. If the result is larger, I keep the change. If the result is smaller, I throw the change out.
I rinse and repeat until I find a mana curve for which all possible small changes result in a smaller metric. That mana curve is my answer: the curve that maximizes my metric.
The technique is called hill climbing because I slowly climb up the hill to the largest value for the metric.
Optimizations
I also use a few optimizations to speed up the algorithm. The use of mulligans significantly increases the number game states I must account for when calculating the value of the metric for a given mana curve. Similarly, calculating the metric both on the play and on the draw doubles the length of the calculation. So I do not initially run the hill climbing method with mulligans or accounting for games when I am on the draw. Instead, I run the calculation only on the play and without mulligans. That quickly gets me close to the answer. I take the result of that faster calculation and use it as the starting point for a second hill climb. In that second hill climb, I add back in the effect of mulligans and of games on the draw. Each step in the second climb is slower, but very few steps are required, as I am starting very close to the maximum.
Another technique I use to speed up the algorithm is to not always choose my small change randomly. Instead, if my previous change was accepted, I repeated that change until it results in a smaller value for the metric. For example, if I found that the metric was increased by removing a two-drop and adding a three-drop, I continue to remove two-drops and add three-drops until it eventually makes the metric drop. At that point, I choose my next step at random. It’s a simple change, but it substantially reduces the number of iterations required.
Local Maxima
There is a danger in using the hill climb method that I should mention. It is possible that in the space of all possible mana curves, there is more than one "hilltop." That is, there is more than one mana curve for which all possible small changes result in a smaller metric. One of those mana curves will have a larger value for the metric than the others. That curve is the correct answer and is called the global maximum. The other hilltops are traps. They are known as local maxima because they have the highest value for the metric in their local area.
When I run my hill climb algorithm, it is possible that the answer I get is a local maximum, not the true global maximum, and there is no immediately way for me to tell one from the other.
To combat this problem, I run the hill climbing algorithm several times, each time using a different starting point. If all of the starting points result in the same answer, I can be reasonably confident that I have found the correct answer, the global maximum. If I get different answers using different starting points, I know that I have found several local maxima. I must continue to rerun the algorithm until I stop finding new local maxima. At that point, I take the largest of them as my final answer.
Takeaways
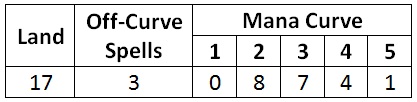
Here is the mana curve which maximizes the average amount of mana spent during the first five turns of the game. This assumes the deck will contain three spells that are not appropriate to cast on curve, such as removal or combat tricks.
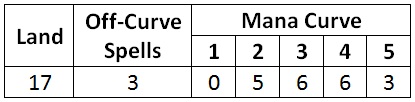
Here is the mana curve that maximizes a metric that accounts for the fact that low-cost spells cast later in the game are less impactful.
If you are playing an extremely aggressive deck that has no plan to win the long game, consider playing nineteen or 20 lands. It will improve the consistency of your development in the early game. If you truly have no way to win when the game goes long, increasing the number dead draws in the late game is of no consequence.
Hiatus
Unfortunately, this is likely to be the last article in my Limiting Chance series; if not forever, then at least for some time. If everything goes according to plan, by the time you read this I will have two twin boys! While I very much look forward to teaching them applied statistics via Magic, I don’t think they’re going to allow me the excess time that writing Limiting Chance requires. At least not any time soon.
Wish me luck!
The full catalog of past Liming Chance articles can be found here.
[email protected]
@DanRLN on Twitter
Source Code for the Magic Probability Toolkit