Now that we’ve got a few weeks of Return to Ravnica under our belt, I want to step away from generic investigations and spend a few articles focusing on
the set.
When I first looked at the Return to Ravnica spoilers, one thing that struck me was the large number of high-cost creatures at common. That made me
curious. How do the creatures in Return to Ravnica differ from an average set? When viewed as a whole, are there any broad trends that distinguish Return
to Ravnica creatures from those in a core set? Let’s investigate and see if there are any differences we can find.
Converted Mana Cost
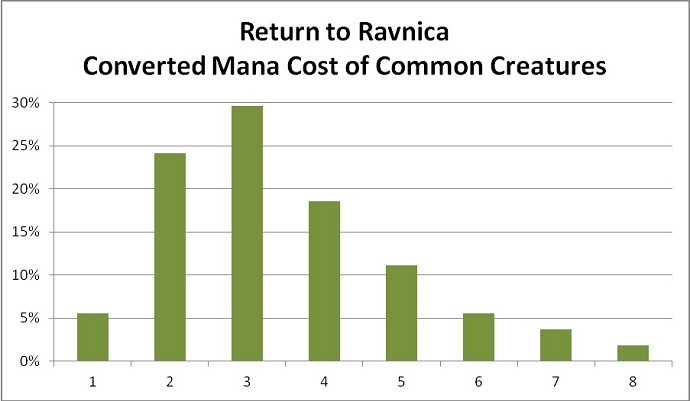
Here is a histogram of the converted mana costs of the common Return to Ravnica creatures. I’ve normalized the graph to sum to 100%. Each bar in the graph
is the probability of a common creature having that casting cost when you pull it from a pack.

The graph includes only common creatures. For a full analysis, I need to include creatures of every rarity. My goal is to demonstrate the relative
frequency of each casting cost as it appears in packs. To meet that goal, I must give each rarity a different weight in the analysis. Any given uncommon or
rare card has a smaller chance of appearing in booster packs than any given common card. As such, uncommon and rare cards have a reduced impact on the
average casting cost.
The first step is to calculate for each card the probability of that card appearing in a pack. In the case of commons, that chance is equal to the number
of common cards in a booster, 10, divided by the number of different common cards in the set. Return to Ravnica has 101 commons. Here is a table of the
numbers for each rarity. Recall that one out of every eight packs contains a mythic rare in the rare slot.
|
Rarity |
Number in a Booster Pack |
|
Number in the Set |
|
Probability of a Particular Card Appearing in a Return to Ravnica Booster Pack |
|
common |
10 |
÷ |
101 |
= |
9.9% |
|
uncommon |
3 |
÷ |
80 |
= |
3.8% |
|
rare |
0.875 |
÷ |
53 |
= |
1.7% |
|
mythic rare |
0.125 |
÷ |
15 |
= |
0.8% |
First aside — Looking at the table, it’s interesting to note that each rare card shows up only twice as often as each mythic rare card. (That’s comparing
1.7% to 0.8%.) Some might find that difference surprisingly small. Aren’t rares eight times more common than mythic rares? The reason for the small
difference in frequency is that there are many more rares in the set than mythic rares. There are 53 different rares in Return to Ravnica, but only 15
mythic rares. Once you have a pack with a mythic rare in it, the chance of that card being the one you’re looking for is surprisingly high.
Second aside — If I wanted to be a real stickler, I would need to account for foils. When you get a foil, it replaces a common in the booster. That has the
effect of slightly decreasing the frequency of commons and slightly increasing the frequency of all other rarities. The effect is very small. Only 1 of
every 67 cards in Return to Ravnica is foil. I will ignore foils when calculating my weights.
OK, I’m done with asides. Getting back to the subject at hand, the correct relative weight of common cards over uncommon cards is the ratio of their
probabilities. That’s 9.9% divided by 3.8%, or 2.6. The printing of a card at common has 2.6 times the effect on the limited environment as printing that
same card at uncommon. Similarly, a common has 6 times the weight of a rare and 12 times the weight of a mythic rare.
Here is the resulting histogram of creature casting costs in Return to Ravnica, including all rarities and weighting each card based on how often it
appears in booster packs.
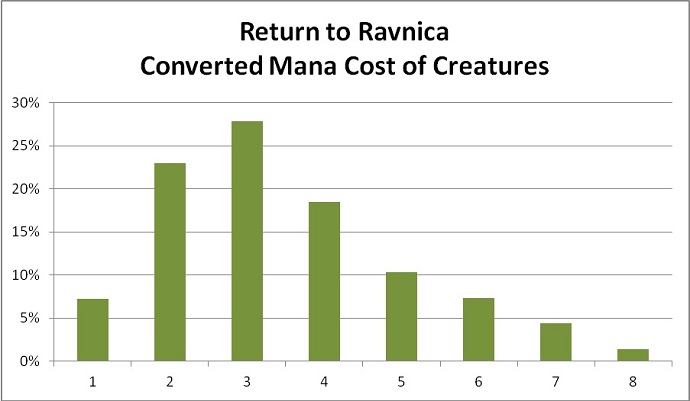
(That was a lot of math just to get another graph that looks basically the same. The higher rarities closely follow the pattern of the commons, and their
appearance in boosters is infrequent. As such their inclusion does not significantly alter the histogram.)
This graph seems reasonable. The peak is at three mana, and it has a smooth tail out to eight. (I have not bothered to extend the graph to eleven for the Worldspine Wurm.)
To draw conclusions from the Return to Ravnica graph, I need something to compare it to. Let’s look at Magic 2013. It’s a great comparison because not only
did we all just get done playing it, but it’s also a core set. As a core set it should provide a good baseline for comparison.
Here is the weighting of the rarities for Magic 2013. Because the number of cards in each rarity differs between sets, the weightings also differ. In
particular, there are substantially fewer uncommons in M13. An individual uncommon in M13 has a bigger impact on the set than an uncommon does in Return to
Ravnica.
|
Rarity |
Number in a Booster Pack |
|
Number in the Set |
|
Probability of a Particular Card Appearing in a Magic 2013 Booster Pack |
|
common |
10 |
÷ |
101 |
= |
9.9% |
|
uncommon |
3 |
÷ |
60 |
= |
5.0% |
|
rare |
0.875 |
÷ |
53 |
= |
1.7% |
|
mythic |
0.125 |
÷ |
15 |
= |
0.8% |
Using those weights, here is the histogram of creature costs in Magic 2013.
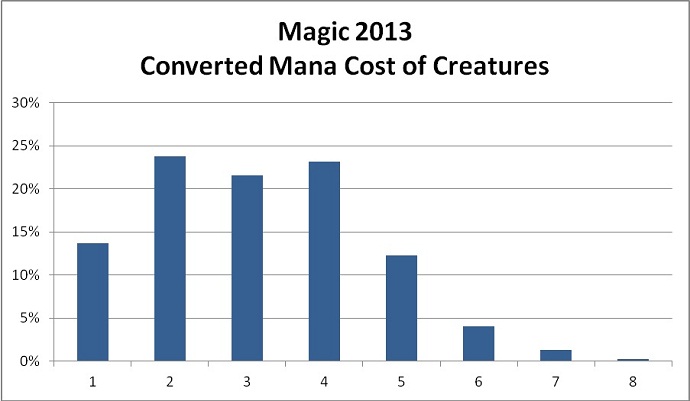
I see a few things when I compare the two sets’ histograms. The peak in M13 is much flatter, spread evenly across two through four mana. There are more
one-drops in M13 and fewer creatures at six mana and up.
Here are the histograms in a single graph, to more easily see the differences.
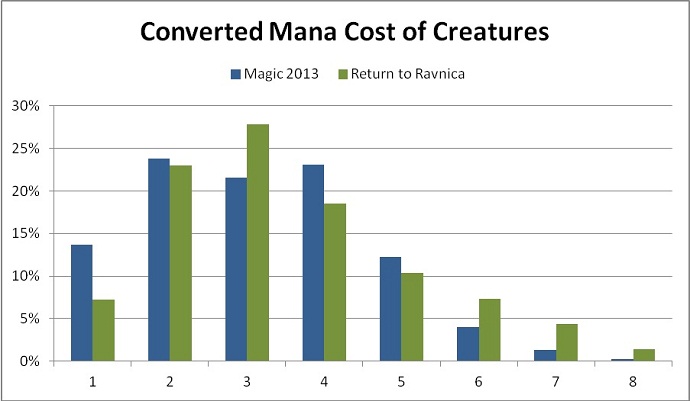
Return to Ravnica has about 30% more three-drops than M13. That should mean three-drops are easier to come by when I am looking to fill out my curve. It
also has about 20% fewer four-drops, so I might have a slightly harder time finding those.
The most striking difference is the significant drop in frequency of very low-cost creatures, and an increase in very high-cost creatures. Return to
Ravnica has half the density of one-drops as M13, and the tail out to high casting costs stays robust to seven mana. This indicates to me that the format
is meant to play slower than Magic 2013. It seems unlikely that Wizards would print that density of high-cost creatures if they did not plan for them to be
playable.
Average Cost
Once I have a histogram, it is straightforward to calculate a weighted average.
|
Set |
Average Converted Mana Cost of Creatures in a Booster |
|
Magic 2013 |
3.15 |
|
Return to Ravnica |
3.48 |
Again we see that casting costs are higher overall. The average casting costs of creatures in Return to Ravnica is one-third of a mana higher than in M13.
How do these casting costs break down across the guilds? Rakdos is widely considered to be the most aggressive guild. Does that mean its average casting
cost will be the lowest? To investigate that, I calculated the average casting cost of the creatures available to each guild. A monocolored creature counts
towards both guilds containing its color. A hybrid creature counts towards all three guilds that can cast it. The Street Sweeper counts towards everybody. Here are the results.
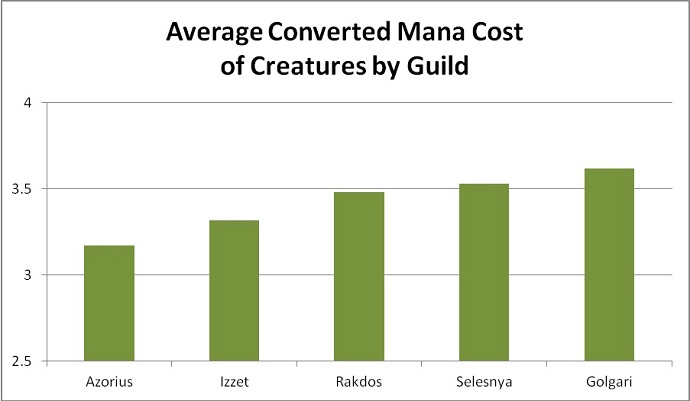
Rakdos is not the guild with the cheapest creatures. Rather Azorius is, with Rakdos sitting right in the middle. I was surprised by these results when I
first saw them, but when I actually look at those two guilds’ creatures, I can see that it is true. Azorius creatures tend to be fairly low cost, nothing
much over four mana. In common, Isperia’s Skywatch is the only six-drop, and Voidwielder is the only five-drop. That contrasts with the Rakdos colors, which
have a bunch of common beef at five and up: Terrus Wurm,Tenement Crasher,Batterhorn,Catacomb Slug,Golgari Longlegs, and Spawn of Rix Maadi. Many of those creatures are clearly not meant to go in a
fast, aggressive Rakdos deck; but some are. Anyone who has faced down a 6/4 Spawn on turn five would consider it a fast creature, despite its five-mana
casting cost.
What this tells me is that the speed of the format is not dictated by the casting cost of its creatures. The higher average cost indicates that Wizards
expects the format to play slower. However, it is not the cause of the slower format. What is the cause? Well, this is partially conjecture,
partially experience, and partially parroting what I’ve read in blogs by the developers themselves. The format is slower because it has awkward removal,
low-power or expensive evasion, and very playable defenders. It remains fun because it has a high density of late-game abilities that break through board
stalls.
Or perhaps I am wrong. Perhaps the format is not slower. What has been your experience?
Toughness
Another creature characteristic that can distinguish a set is toughness. A set’s toughness distribution tells you what it takes to kill a creature. In some
sets, all it takes is two damage to kill many of the relevant creatures, and Shocks are more than adequate removal. Other sets require a full three damage
to kill most creatures, and a Lightning Bolt is what is called for. Where on
the spectrum does Return to Ravnica sit? Let’s take a look at the toughness distribution across creatures.
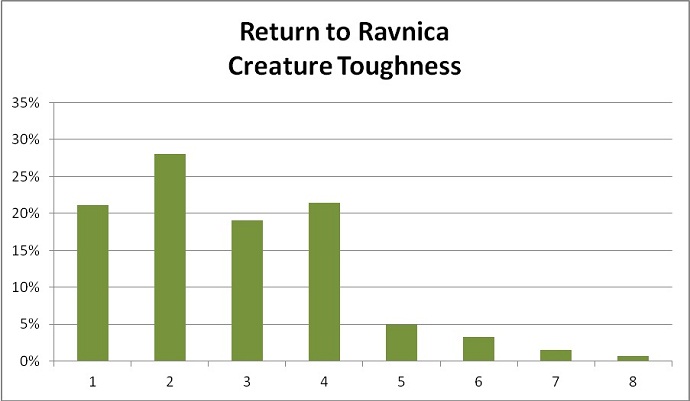
The peak is at two toughness, but the distribution is fairly flat out to four. What is really striking is the cliff beyond four toughness. There are very
few creatures that have toughness of five and greater. This distribution indicates that Auger Spree is a great card in the context of the set. It is able to kill every
creature up to and including four toughness (that’s 90% of creatures) at relatively low cost.
How does this compare to Magic 2013’s toughness distribution?
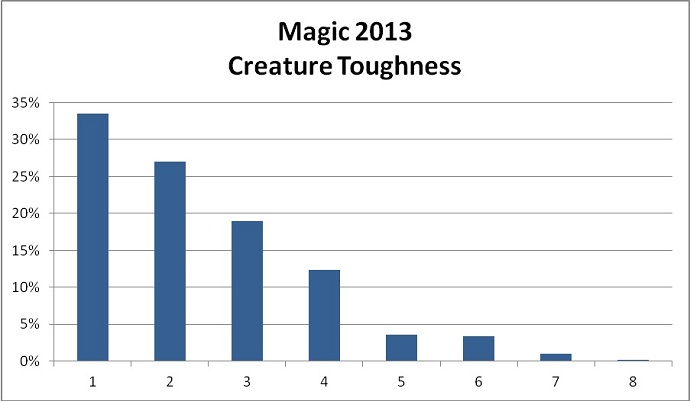
There are more one-toughness creatures and fewer four-toughness creatures. The result is a much smoother curve with no distinct cliff.
Removal
Knowing the toughness distribution, I can calculate the kill rates of common removal spells. Specifically, I will look atElectrickery,Stab Wound,Annihilating Fire,Auger Spree, and Explosive Impact. What percentage of the creatures appearing in booster packs
can each spell kill?
|
Spell |
Toughness Killed |
Percentage of Creatures Killed |
|
1 |
21.1% |
|
|
2 |
49.1% |
|
|
3 |
68.2% |
|
|
4 |
89.6% |
|
|
5 |
94.5% |
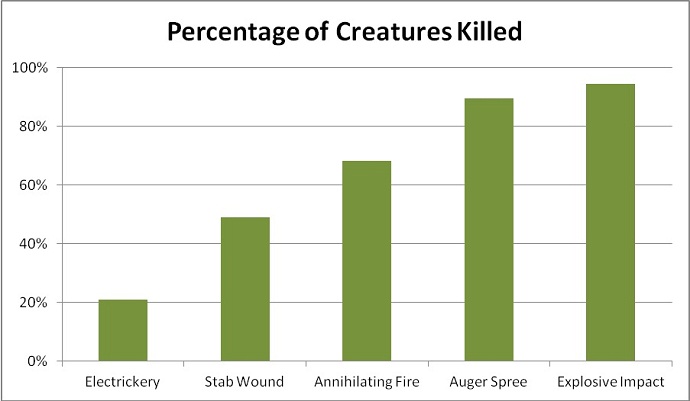
As expected, Auger Spree demonstrates itself to be a spectacular card in this
set, with a very high kill rate. At the same cost as Annihilating Fire, it can
kill markedly more creatures. It is also much cheaper than Explosive Impact,
which can kill only slightly more creatures.
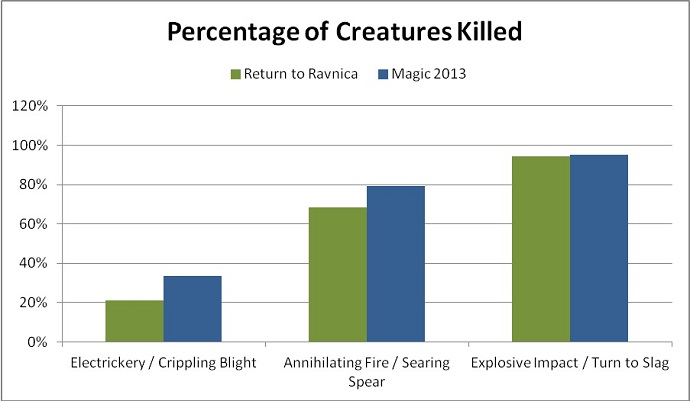
For comparison, here are the kill rates for a few of the common removal spells in Magic 2013.
|
Spell |
Toughness Killed |
Percentage of Creatures Killed |
|
1 |
33.5% |
|
|
3 |
79.4% |
|
|
5 |
95.3% |
Electrickery
and Crippling Blight both kill one toughness creatures, but because of the
dearth of such creatures in Return to Ravnica, Electrickery kills only 63% as
many creatures as Crippling Blight did in M13. Similarly, because of the large
number of four-toughness creatures in Return to Ravnica, Annihilating Fire does
not pack quite as strong a punch as Searing Spear. It kills 86% as many
creatures as Searing Spear.Explosive Impact‘s kill rate is about the same as Turn to Slag‘s.
Looking at the kill rate of these removals spells piques my curiosity about spells that key off of characteristics other than toughness. Here are the kill
percentages of a few other conditional removal spells in Return to Ravnica.
|
Spell |
Kill Condition |
Percentage of Creatures Killed |
|
power 5 or greater |
11.9% |
|
|
flying |
18.2% |
|
|
monocolored |
69.5% |
|
|
converted mana cost 3 or less |
63.3% |
The kill rate of Selesnya Charm andAerial Predation are quite low.Selesnya Charm obviously has a lot of other reasons to play it, butAerial Predation is definitely sideboard material.Ultimate Price is quite strong. It has a kill rate comparable toAnnihilating Fire. Abrupt Decay is also strong but rare.
Finally, it’s a little bit of a silly thing to do, but I can calculate the kill rate per mana of the removal spells. I’ve added to the mix one of the set’s
expensive unconditional pieces of removal, Trostani’s Judgment, for comparison.
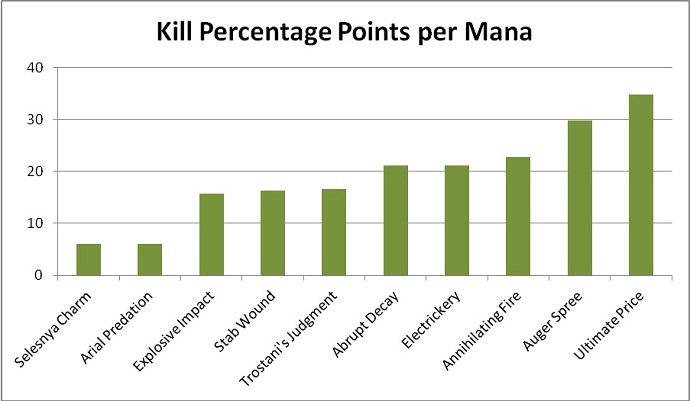
As expected, Auger Spree offers great value. Ultimate Price is also very efficient. Its low cost makes up for its somewhat
smaller kill rate. The high cost of Explosive Impact and Trostani’s Judgment reduces their score despite them having the best kill
rates.
Other Considerations
This is of course not the final say when it comes to the relative quality of these removal spells.Electrickery can be overloaded andStab Wound offers reach.Explosive Impact can go to the face, while Auger Spree cannot. Looking at the kill rates is only one input into the larger
analysis that must be done when building a deck.
Frequency in Decks
For these investigations, I weighted each creature based on the frequency it appears in booster packs. That is not the most important frequency. A more
relevant frequency is the rate the creature appears in decks. Sure, Terrus Wurm
is seven mana and brings up the average creature cost, but is anyone playing it? Is it actually increasing the average cost of creatures in decks? I don’t
know. It depends largely on the environment in which you play. Is there a way to determine the rate of play of a card? It is on the edge of feasible to
watch Magic Online replays and record the usage rates of cards. Even then, however, the numbers might not be relevant to the environment in which you play.
The rates at FNM will be different at each store, and different from Magic Online, and different again from a Grand Prix.
Using booster appearance rates in the best I can do with the data available. The approach also has a certain purity about it, as it informs us about the
set itself, not what players are currently doing with the set.
Appendix on Methods
In this analysis I had to make a few calls on how to handle certain creatures. I want to be open about my methods, so here is a rundown of how I treated
every card that I did not take at face value. Feel free to skip this section.
I counted as creatures all spells that primarily create creature tokens. Those areCoursers’ Accord,Horncaller’s Chant,Eyes in the Skies,Goblin Rally,Security Blockade,Selesnya Charm,Captain’s Call,Krenko’s Command, andTalrand’s Invocation. I counted the keyrunes as creatures. I countedCentaur’s Herald as a three-mana 3/3. I countedGrove of the Guardian as a six-mana 8/8. I counted Hellion Crucible as a 4/4 creature, but left it out of the casting-cost
analysis. I assumed all creatures with unleash are unleashed. For creatures with adjustable toughness, I used their base toughness. Those arePerilous Shadow,Frostburn Weird, and Liliana’s Shade. I left creatures with toughness-defining abilities out of the
toughness analysis. Those are Cryptborn Horror,Pack Rat,Wayfaring Temple,Clone, andSerra Avatar. I leftSlime Molding and Primordial Hydra out of the analysis entirely. For M13’s allied-color uncommon
cycle (Arctic Aven,Crimson Muckwader,Flinthoof Boar,Harbor Bandit, and Prized Elephant), I assumed that they had the bonus granted by their allied
land. I assumed Primal Clay is cast half the time as a 3/3 and half the time as
a 2/2 flyer.
You can find the spreadsheets I used in the analysis here. Be warned that they are not
organized for ease of understanding. I found Chaudakh’s Gatherer Extractor to be very useful during the analysis.
Takeaways
Return to Ravnica has fewer one-drops and more creatures at six mana and higher than Magic 2013. The average casting cost of creatures is one-third of a
mana higher. This likely indicates that it is a slower than average set.
Creatures with toughness one through four appear with approximately equal frequency in the set. The number of creatures with toughness greater than four is
relatively small. This indicates that Auger Spree is very strong removal in the
context of the set.
In general the removal spells in Return to Ravnica are slightly less effective, or efficient, than their counterparts in Magic 2013.
[email protected]
@DanRLN on Twitter
source code for the Magic Probability Toolkit